Experimental balancing using the SE-5
Example of the Aura in Motion analysis system.
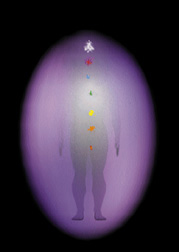 This image shows the Throat, Heart, and Base Chakras operating at less than optimum. The aura is small, indicating stress.
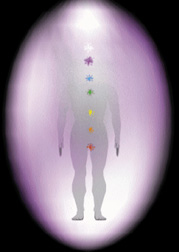 This
image shows what the aura and Chakras could look like after balancing
with the SE-5 plus. (As shown by our character, John, in the example in
Chapter 3.) Aura has increased in size and is lighter in color.
This
image shows what the aura and Chakras could look like after balancing
with the SE-5 plus. (As shown by our character, John, in the example in
Chapter 3.) Aura has increased in size and is lighter in color.
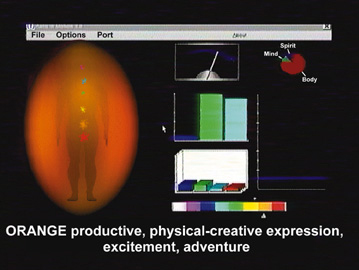 Aura
in Motion as seen on the computer screen. Many other graphs give
information in addition to the aura colors, i.e., Emotion graph,
Relaxation/Stress graph, Body, Mind, Spirit graph, Color Personality
graph, (with indicators for right brain, left brain) State of Mind Body
Meter, and Energy level graph.
Aura
in Motion as seen on the computer screen. Many other graphs give
information in addition to the aura colors, i.e., Emotion graph,
Relaxation/Stress graph, Body, Mind, Spirit graph, Color Personality
graph, (with indicators for right brain, left brain) State of Mind Body
Meter, and Energy level graph.

